15 Field of View Comparison
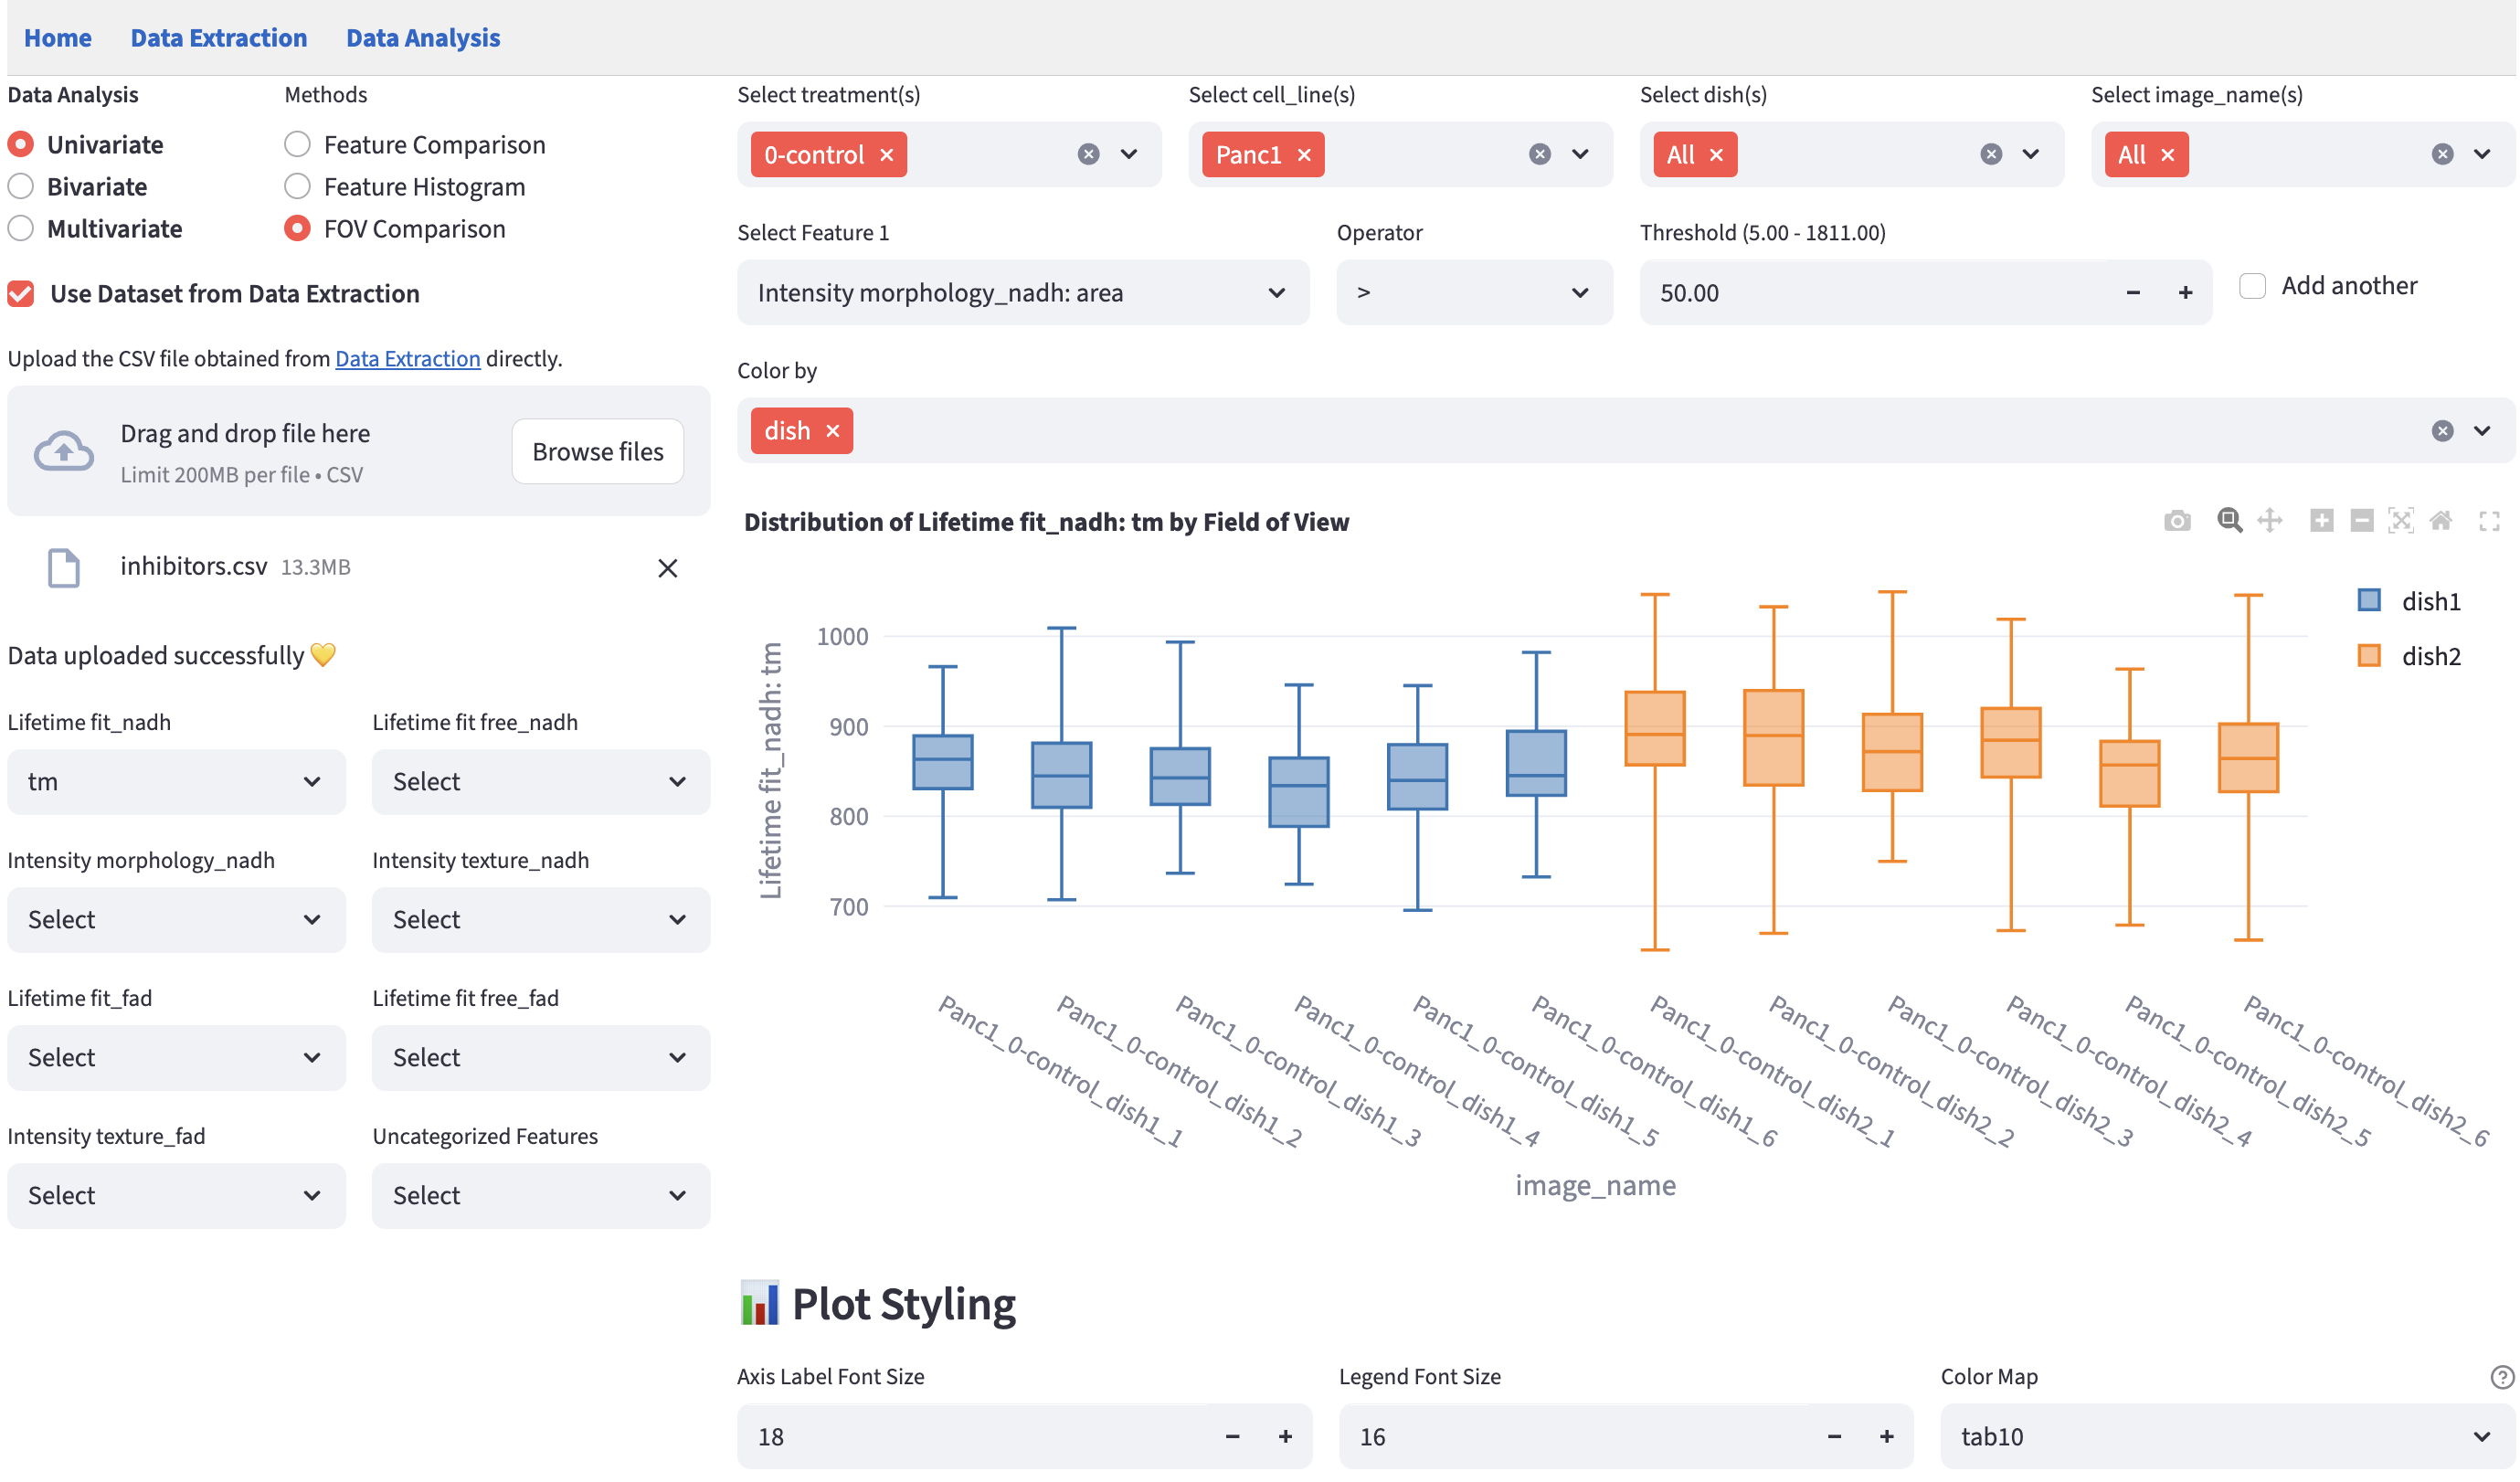
In imaging datasets like FLIM data, field of view (FOV) is an important categorical feature that documents where a certain set of rows (e.g. cells) originate. Visualizing each FOV side by side on a numerical feature can help identify potential FOV-level outliers.
FLIM Playground finds the FOV identifier column from the dataset using the FOV column name field in data analysis config (dataset not extracted by Data Extraction) or data extraction config (dataset extracted by Data Extraction).
If the FOV identifier column is not found in the dataset, then a warning message will be shown:

If found:
15.2 Example
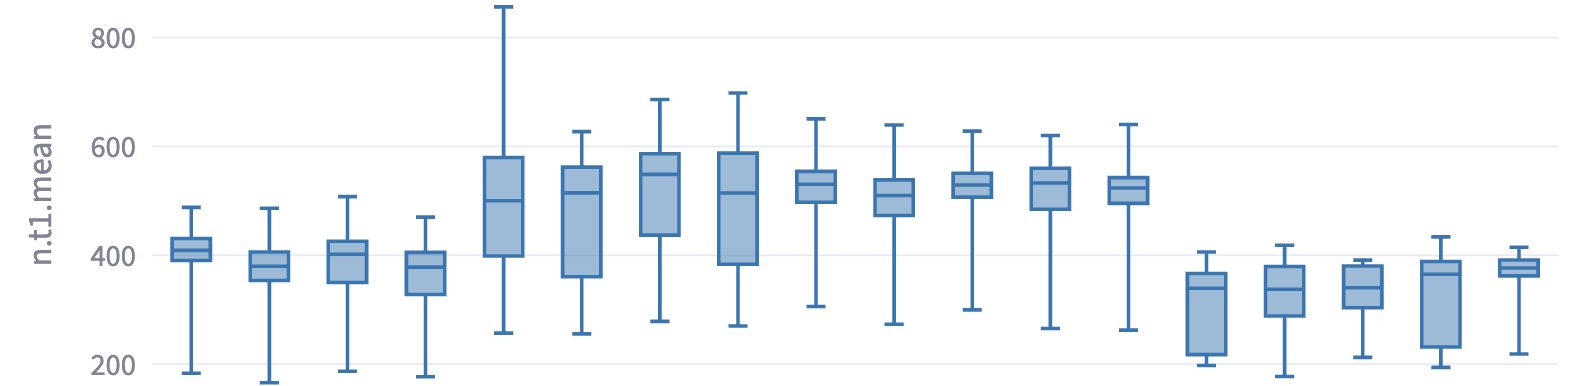
Sometimes, the FOV-level boxplots may show consistent divergence across different imaging days, which may suggest that there is experimental or data extraction inconsistency (e.g. shifts are not optimized correctly for one day versus the others). Below is an example that, despite the same conditions, systematically diverged across days, but was consistent within the same day.