20 Dimension Reduction
To represent and visualize high-dimensional data in a meaningful way and help users interpret the data, dimension reduction methods project the data into a lower-dimensional space. Three popular dimension reduction methods are often used: UMAP, PCA, and t-SNE.
Principal Component Analysis (PCA) is a linear dimension reduction method that projects the data onto the directions of the largest variance. It is fast, deterministic, and easier to interpret (the percentage of variance explained by each principal component is reported on the axis labels), but it is limited by the linear nature of the projection. For a detailed discussion of PCA, please refer to this post.
Uniform Manifold Approximation and Projection (UMAP) and t-Distributed Stochastic Neighbor Embedding (t-SNE) are non-linear dimension reduction methods that can capture more complex patterns in the data. They are more flexible and can handle non-linear relationships between features, but they are more computationally expensive, less interpretable, not deterministic (FLIM Playground uses the random seed 42 to ensure reproducibility), and dependent on the hyperparameters. Here is a post that explains how UMAP and t-SNE work at a high level and the meaning of some of the hyperparameters.
Select at least two numerical features. The app removes rows missing any selected feature, standardizes each feature to a z-score, and fits one two-dimensional embedding to the remaining filtered observations.
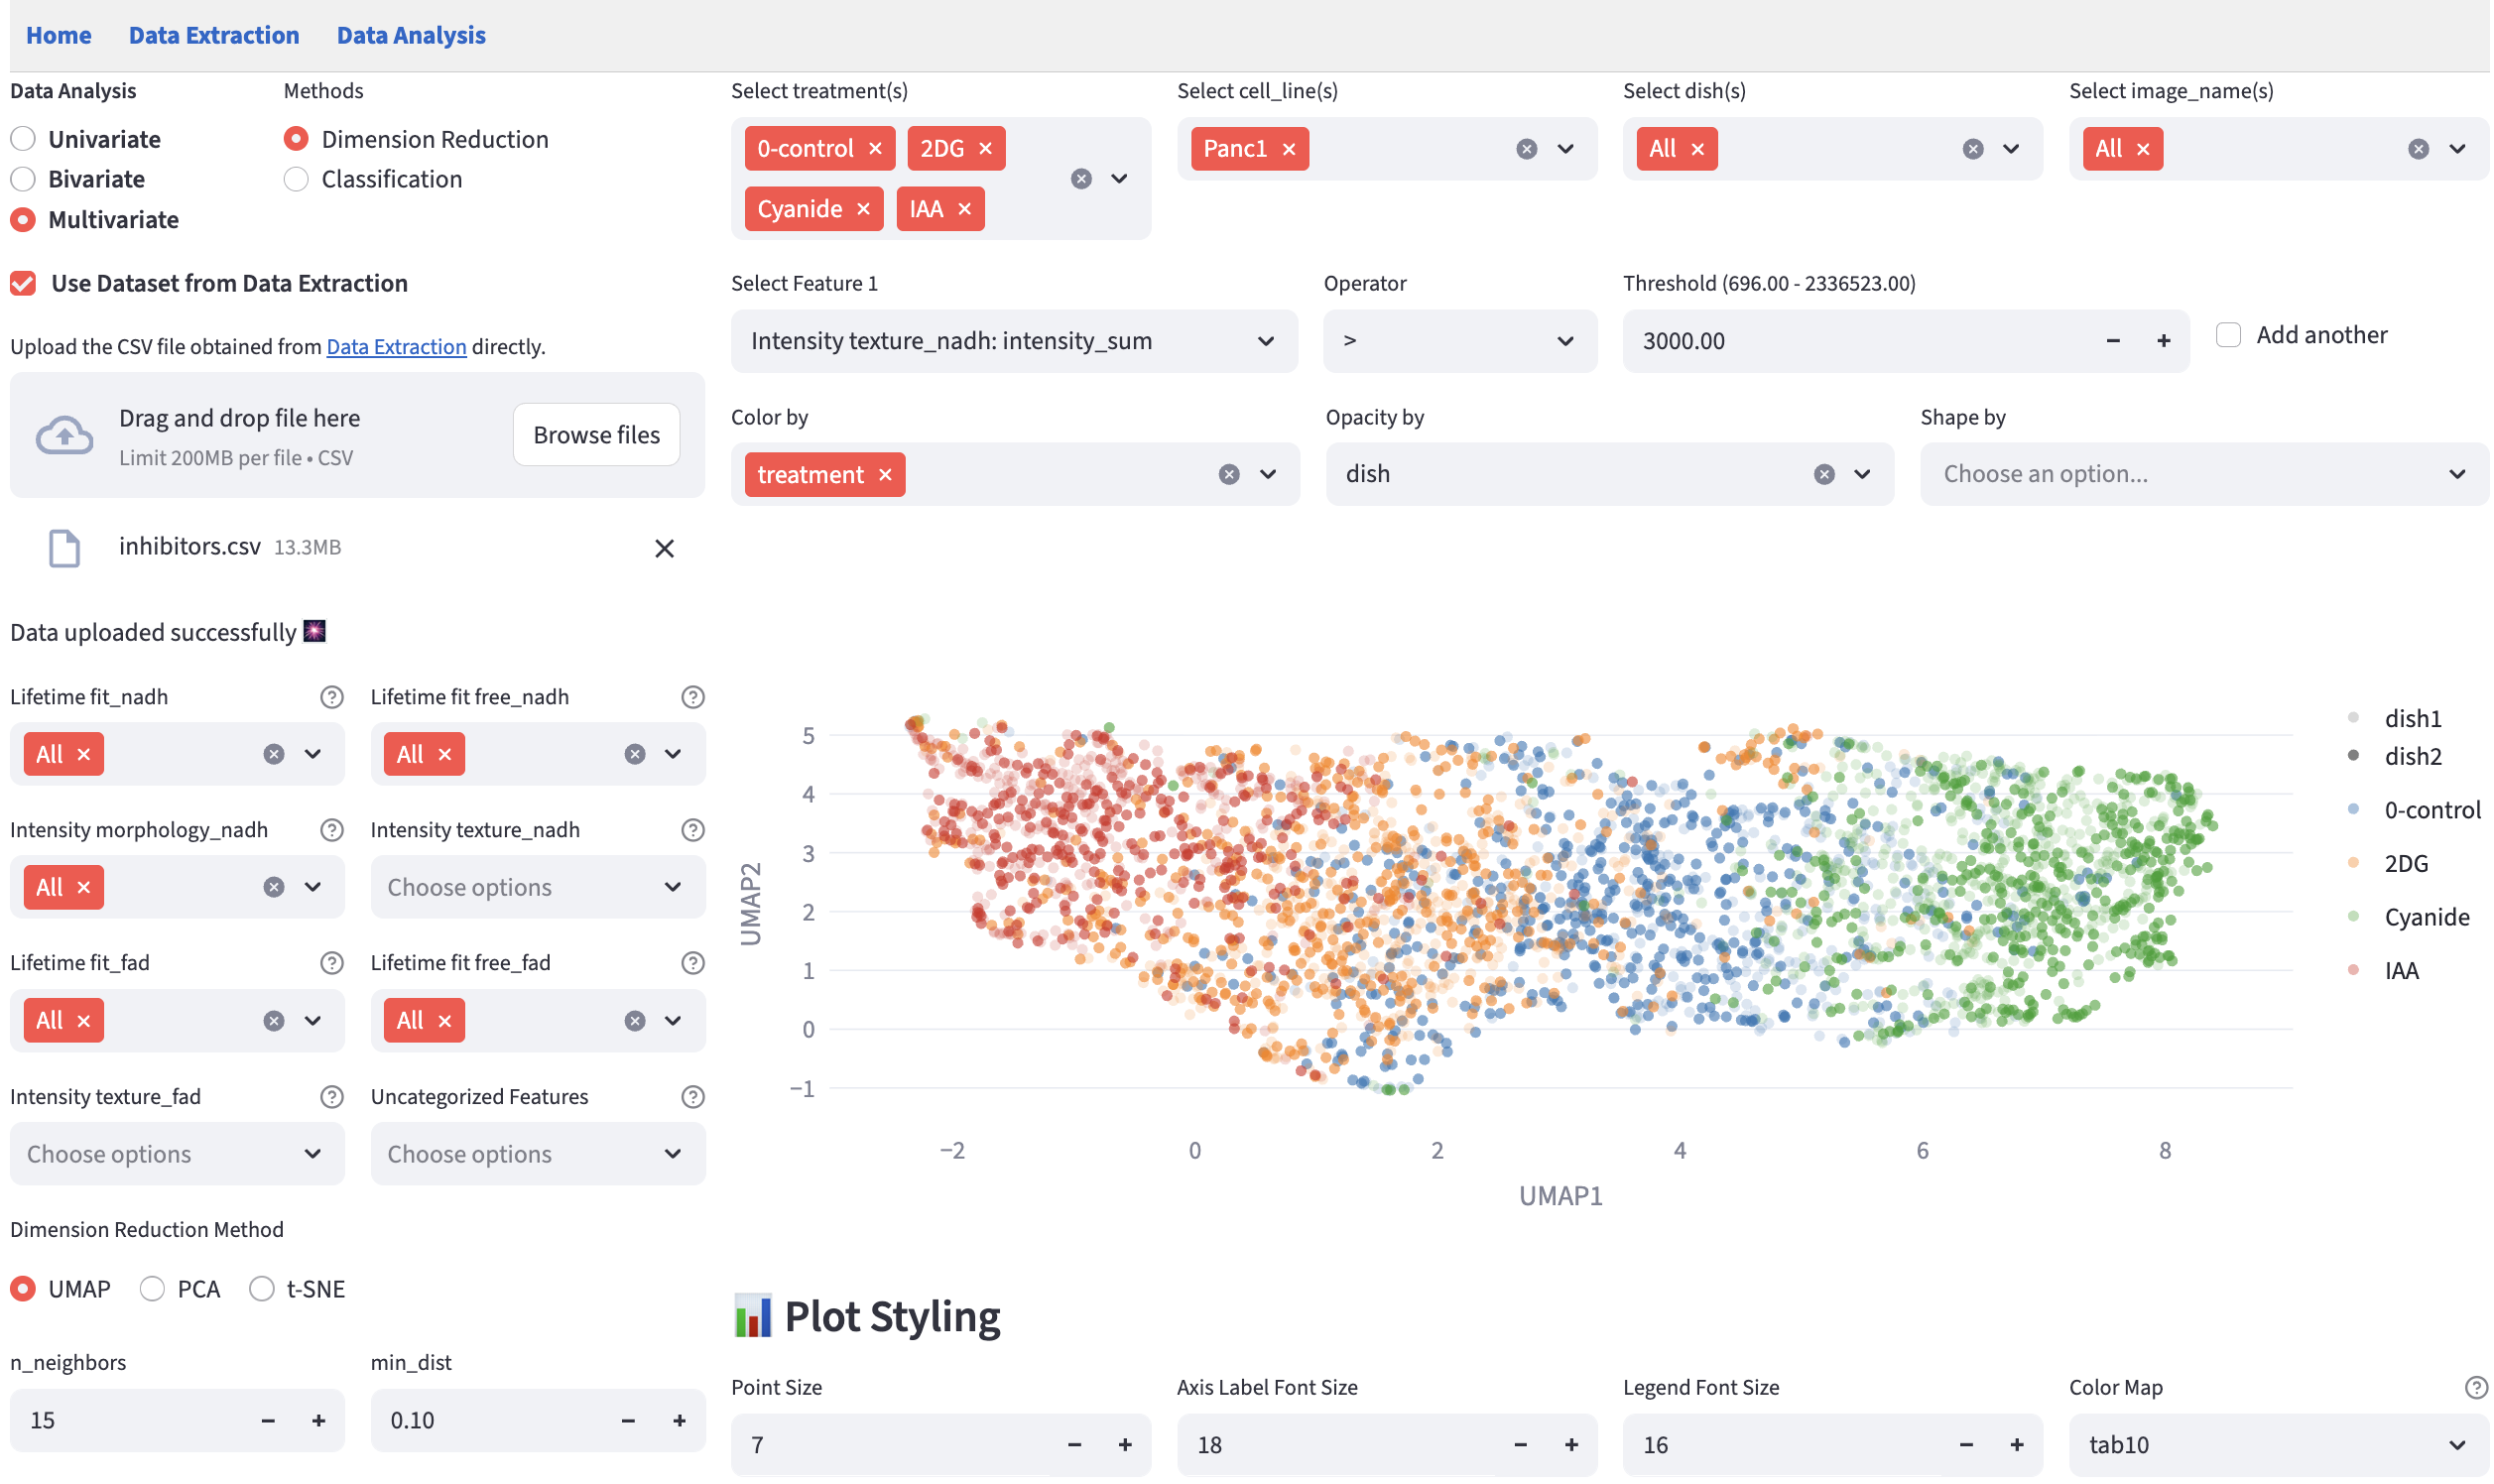
0-control and IAA treatments, colored by cell_line, with Separate by left empty.20.2 Separate by
Choose up to two categorical columns in Separate by to display a shared overview beside smaller category maps:
- One column creates a vertical stack of maps, one per category.
- Two columns create a matrix: the first selected column defines rows and the second defines columns. A combination with no observations still has a panel showing the gray context.
Each small map highlights its category’s observations with the same coordinates, colors, shapes, and opacities as the overview. Other observations appear in faint gray. All maps share axis ranges, so positions can be compared directly. A column may be selected in both Separate by and Color by.
Click a category panel to promote it into the main plot. The panel then uses the main plot’s larger space, while the previous overview moves into that panel’s position and is marked Main plot. Click the promoted main plot to restore the overview. Promotion only rearranges already computed traces; changing features, filters, reduction method, or hyperparameters still refits the embedding.
Changing these display controls does not refit the embedding. Changing the numerical features, filters, reduction method, or its hyperparameters does. The shared legend controls groups across the maps, and Show group counts (n) in legend reports counts from the full embedding, rather than separate counts for each small map.
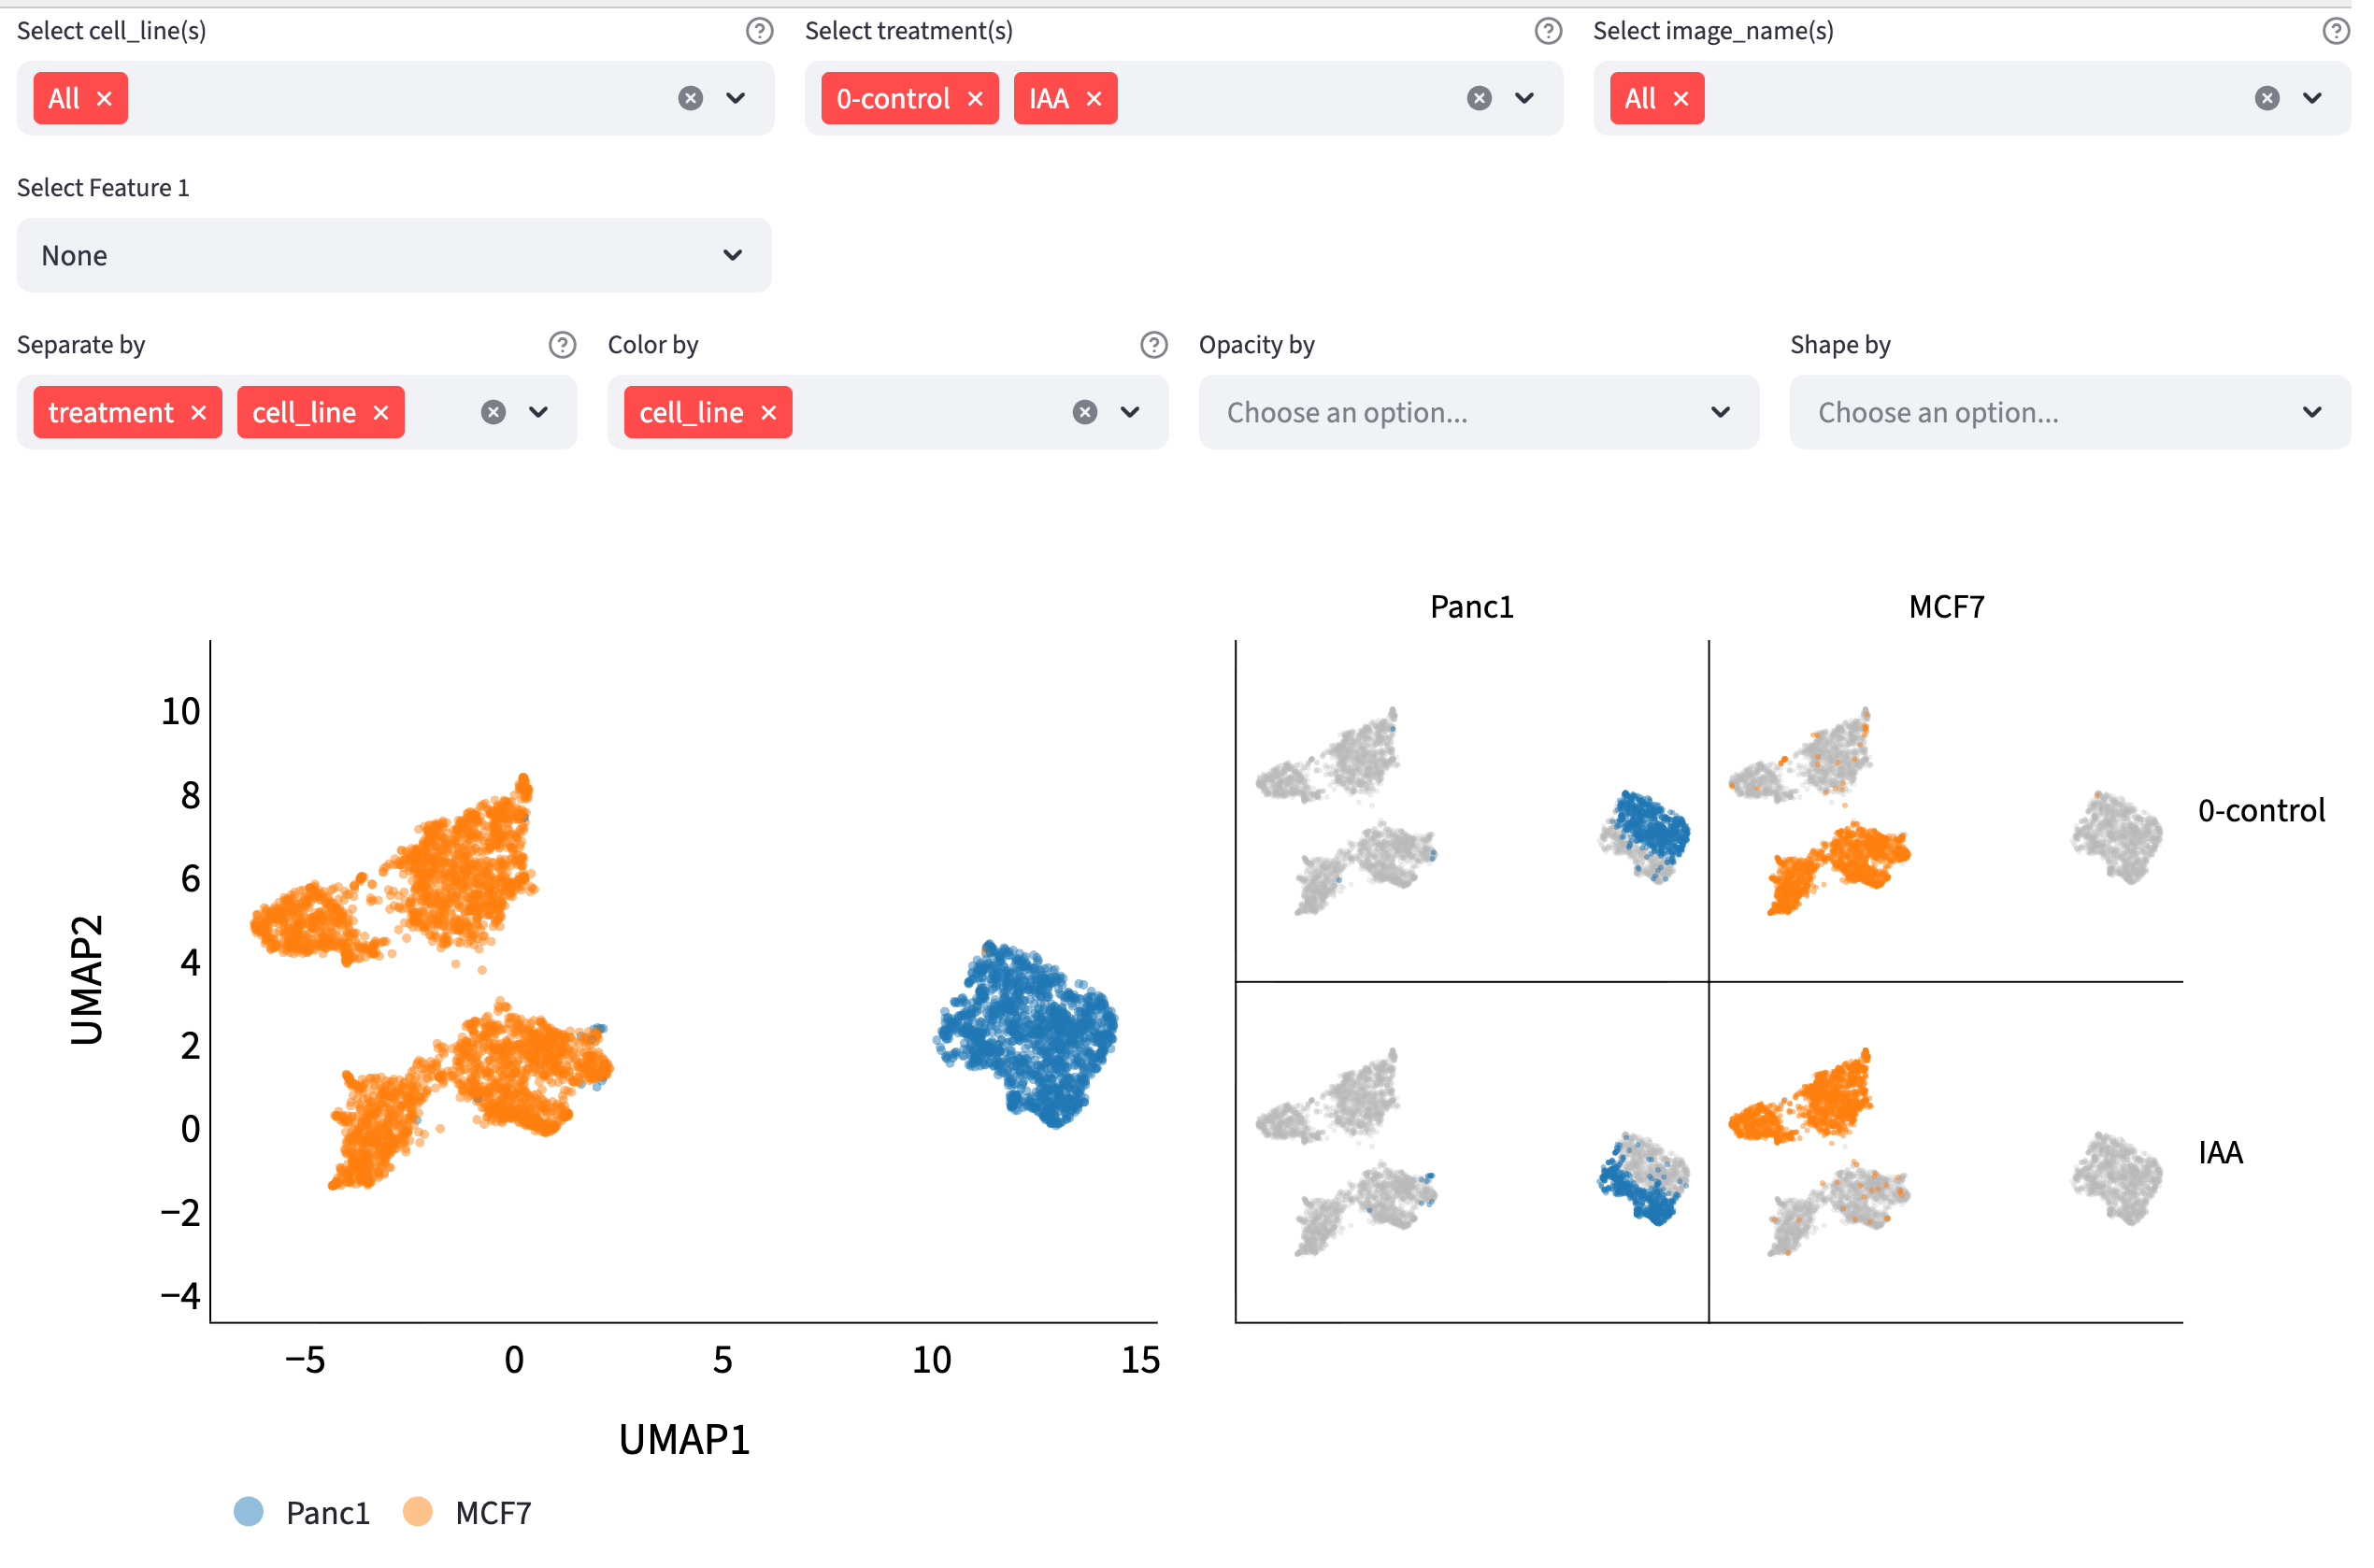
treatment and then cell_line in Separate by to show the same UMAP embedding with treatments in rows and cell lines in columns.20.3 Hyperparameter Widget
Choose UMAP, PCA, or t-SNE in Dimension Reduction Method on the left. UMAP and t-SNE expose the controls below; PCA has no additional hyperparameter controls.
20.3.1 UMAP
FLIM Playground uses the umap-learn implementation of UMAP. n_neighbors (default 15) controls the neighborhood size used to construct the embedding, while min_dist (default 0.1) controls how tightly nearby points can be packed. Other hyperparameters use the implementation’s default values, with Euclidean distance and a fixed random seed of 42.
20.3.2 t-SNE
FLIM Playground uses the sklearn.manifold.TSNE implementation of t-SNE. perplexity (default 15) controls the effective neighborhood size and must be smaller than the number of analyzed observations. early_exaggeration (default 1 in the app) controls the initial emphasis on keeping neighboring observations together. Other hyperparameters use the implementation’s default values, with a fixed random seed of 42.
20.4 Export the analysis
Click Export the entire analysis as a Python script below Plot Styling to retain the selected features, filters, method, hyperparameters, point encodings, category-map layout, and any promoted panel. The script fits the same shared embedding and saves an SVG figure. See the shared script workflow for running it with the original table.